Why a Stream Gage Is the Single Best Waterfall-Timing Tool
Photographs lie about water. A falls shot in May during snowmelt and the same falls in late August can look like two different places, and a wet trip report from last spring tells you nothing about this week. The U.S. Geological Survey runs a national network of stream gages that measure, in near real time, exactly how much water is moving down a river right now. If you can find the gage on the watercourse that feeds your waterfall, you can stop guessing and start reading the actual flow before you drive out.
Each gage reports two core numbers. Discharge is the volume of water passing the gage, expressed in cubic feet per second (cfs) — one cubic foot is roughly the size of a basketball, so a creek running 100 cfs is pushing about 100 basketballs of water past a fixed point every second. Gage height (also called stage) is the height of the water surface in feet above an arbitrary local zero point called the gage datum. The two are linked: USGS hydrographers build a stage-discharge relationship, called a rating curve, that converts the measured water height into a discharge figure.
For a waterfall hunter, discharge is the number that matters most, because it is comparable across time and tells you whether the creek is high or low relative to its own history. Gage height is useful as a quick at-a-glance gut check and for spotting a flood spike, but because the datum is local and arbitrary, a gage height of 4 feet on one river means nothing about a gage height of 4 feet on another. Always anchor your decision on discharge plus its historical context, which WaterWatch provides as a percentile.
Finding the Right Gage: The Feeding Watercourse Comes First
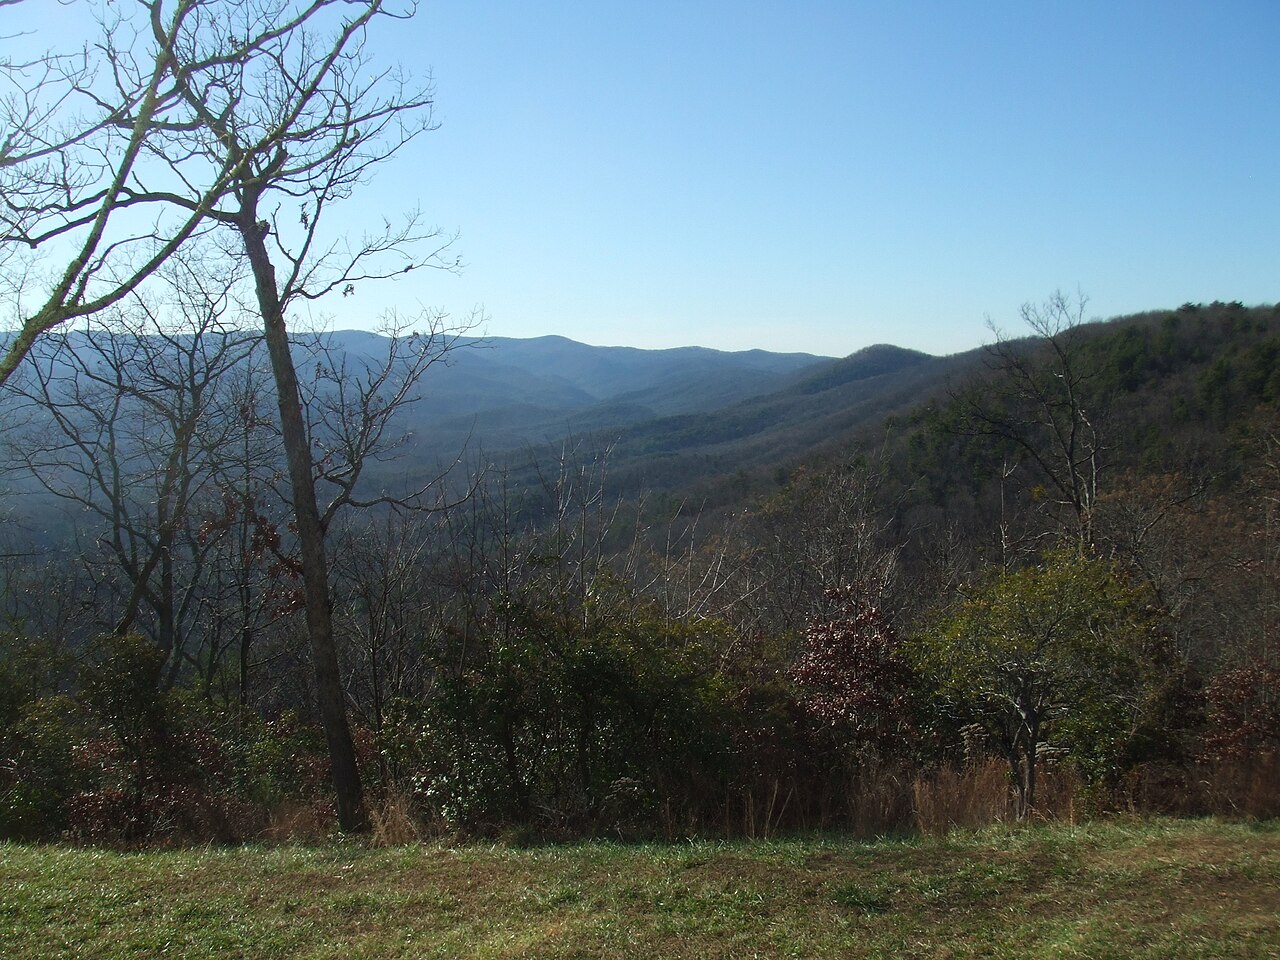
Start with the waterfall's watercourse — the named stream or river it falls on — because that is what the gage measures. ChasingFalls lists this for every entry. Amicalola Falls in Georgia, for example, drops on Amicalola Creek inside Amicalola Falls State Park near Dawsonville, and there is a USGS gage named AMICALOLA CREEK NEAR DAWSONVILLE, GA (site number 02390000) sitting downstream on that very creek. When the gage is on the same watercourse, the reading is about as direct as it gets: when that creek is high, the falls is high.
To find a gage, open the USGS Water Data for the Nation site (waterdata.usgs.gov), search the creek or river name plus the state, or pan the National Water Dashboard map to the falls and look for the nearest dot upstream or on the same stream. Note the eight-digit site number — it is the permanent address you will reuse on every visit. Then sanity-check the geography: a gage upstream of the falls on the same creek is ideal, a gage just downstream (like Amicalola's) is nearly as good, and a gage on a different branch of the basin is only a rough proxy.
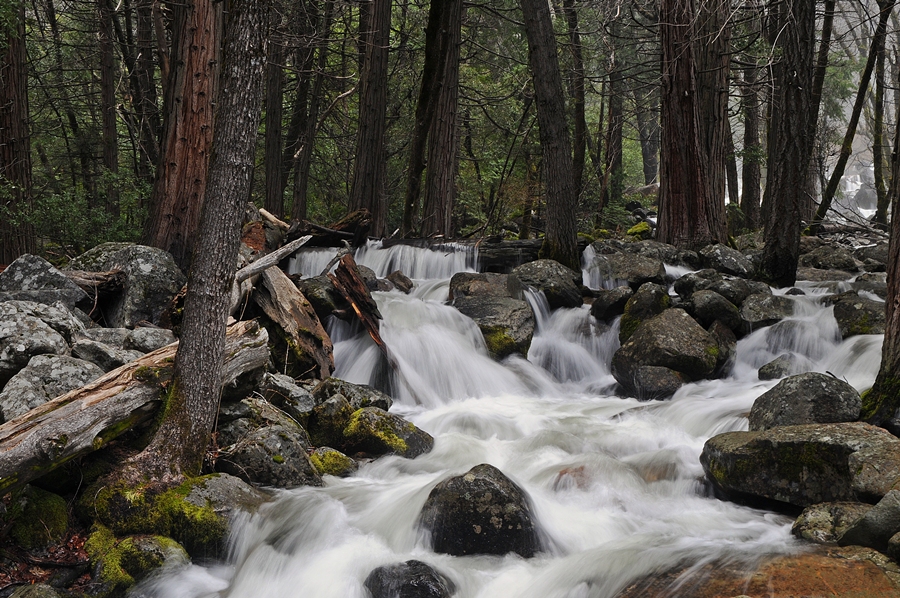
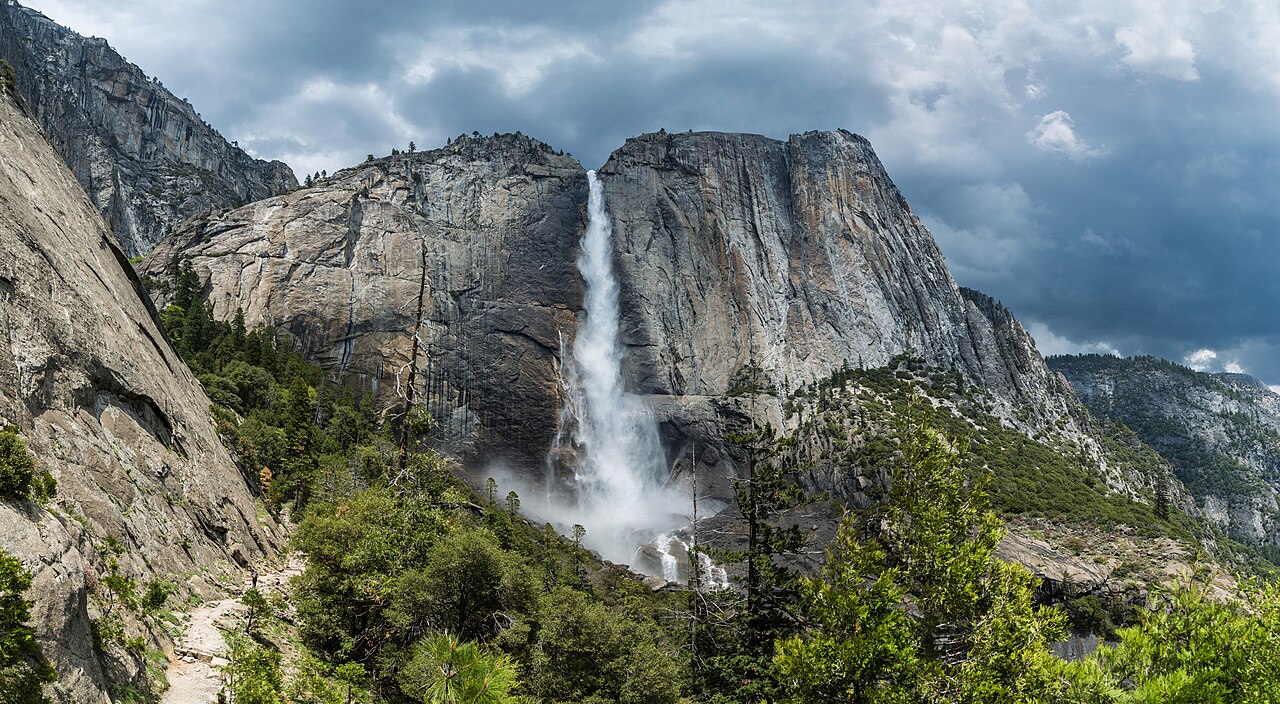
The hard truth is that most individual waterfall streams have no gage of their own. Yosemite is the classic case: there is no USGS gage on Yosemite Creek (which feeds Yosemite Falls) or on Bridalveil Creek (which feeds Bridalveil Fall). The National Park Service instead documents the Merced River gages at Happy Isles (11264500) and Pohono Bridge (11266500) on the valley's main stem. Those mainstem gages don't measure the side creeks directly, but because every Yosemite tributary is fed by the same Sierra snowpack, a rising Merced is a reliable signal that the snowmelt season — and the falls — are ramping up.
Crabtree Falls in Virginia shows the proxy approach in its cleanest form. The falls drops on Crabtree Creek in the George Washington National Forest near Montebello, and Crabtree Creek has no gage. But the creek flows into the South Fork of the Tye River, and the USGS runs TYE RIVER NEAR LOVINGSTON, VA (02027000) on that system. The Tye gage won't give you the exact flow over Crabtree's tiers, but it tells you whether the whole Blue Ridge drainage is wet or in base-flow doldrums — which is exactly what you need to decide whether the trip is worth it.
Reading the Numbers: Discharge, Percentiles, and the Hydrograph
Once you have the gage page open, ignore the single headline number at first and look at the hydrograph — the line graph of discharge over the past several days. A flat or gently declining line means stable conditions. A sharp spike followed by a slow decline is the signature of a storm pulse: rain fell, the creek surged, and it is now receding. For rain-driven falls, you want to catch the day or two on the back side of that spike, while the water is still high but the creek has cleared enough to be safe and the trail isn't a swamp.
Raw cfs only means something once you know what is normal for that stream. The USGS WaterWatch tool color-codes every gage by percentile, comparing today's flow to the full historical record for this calendar day. The 50th percentile is the median — a perfectly ordinary day. Above the 75th percentile (high, often shown in blue) is when most falls look great. Below the 25th percentile (low, in the orange-to-red range) is when a snowmelt or rain-fed falls may be a disappointing trickle. A reading at the 90th percentile means the flow is higher than it has been on this date in 9 of every 10 years on record.
Put real numbers to it. Amicalola Creek near Dawsonville has run as low as the mid-20s cfs in dry spells and has spiked past 7,000 cfs in floods, so a reading around 80 cfs is roughly the median — fine, but not the thundering version of Amicalola Falls you get after heavy spring rain. The Tye River near Lovingston, with its 93-square-mile drainage, sits around 35 to 50 cfs in normal base flow; a reading several times that, after a storm or during snowmelt, is the signal that Crabtree Falls will be running hard. Learn the normal band for your gage and the percentile will make instant sense.
Two cautions on the data. First, real-time values are labeled provisional until USGS reviews them, and the rating curve that converts stage to discharge can shift after floods rearrange the streambed, so treat fresh numbers as close estimates, not gospel. Second, a gage downstream of the falls collects water from side tributaries below the falls, so its cfs is higher than what actually pours over the lip — use it for trend and percentile, not as the literal flow over the drop.
Matching the Gage to the Season: Snowmelt vs. Rain vs. Ephemeral
The gage tells you the flow; the falls' hydrology tells you when to expect that flow to be high. Snowmelt-driven falls dominate the West. Yosemite Falls (2,425 feet, tiered, on Yosemite Creek), Bridalveil Fall (620 feet, a plunge on Bridalveil Creek), and Nevada Fall (594 feet, on the Merced River itself) all peak in the spring snowmelt window, roughly April through June, with the exact timing set by that winter's snowpack and the spring temperatures that melt it. For these, watch the Merced at Pohono Bridge or Happy Isles climb through spring; a rising mainstem in a big snow year is your cue that the tributary falls are surging too. Reported heights for tiered giants like Yosemite Falls are cumulative over multiple drops and vary by source and measurement method, so treat the figure as the falls' overall scale, not a single sheer plunge.
Crabtree Falls in Virginia and Bridal Veil Falls near Provo, Utah (607 feet, tiered, on a Provo River tributary) follow the same snowmelt logic on the eastern and Wasatch sides — best in the April-to-June melt — but they are smaller basins that respond faster to both snow and rain. Amicalola Falls is the rain-and-spring pattern: its best showing comes in spring and especially after heavy rain (March through May), which is exactly when you'll see Amicalola Creek's gage jump on the hydrograph. For a rain-fed falls, the gage is most useful in the 24 to 72 hours after a storm, when you can confirm the pulse arrived and is still running before you commit to the drive.
Multnomah Falls in the Columbia River Gorge (620 feet, tiered, on Multnomah Creek) is the friendliest case: it flows year-round and is generally best from late fall through spring, November to May, fed by Gorge rain and high-country melt. Even here the gage habit pays off — a Gorge rain event will pulse the local creeks, and Multnomah's two-tier drop is at its most dramatic when the basin is wet. Because Multnomah Creek itself isn't gaged, the nearby Gorge and Sandy River basin gages serve as the regional wetness proxy.
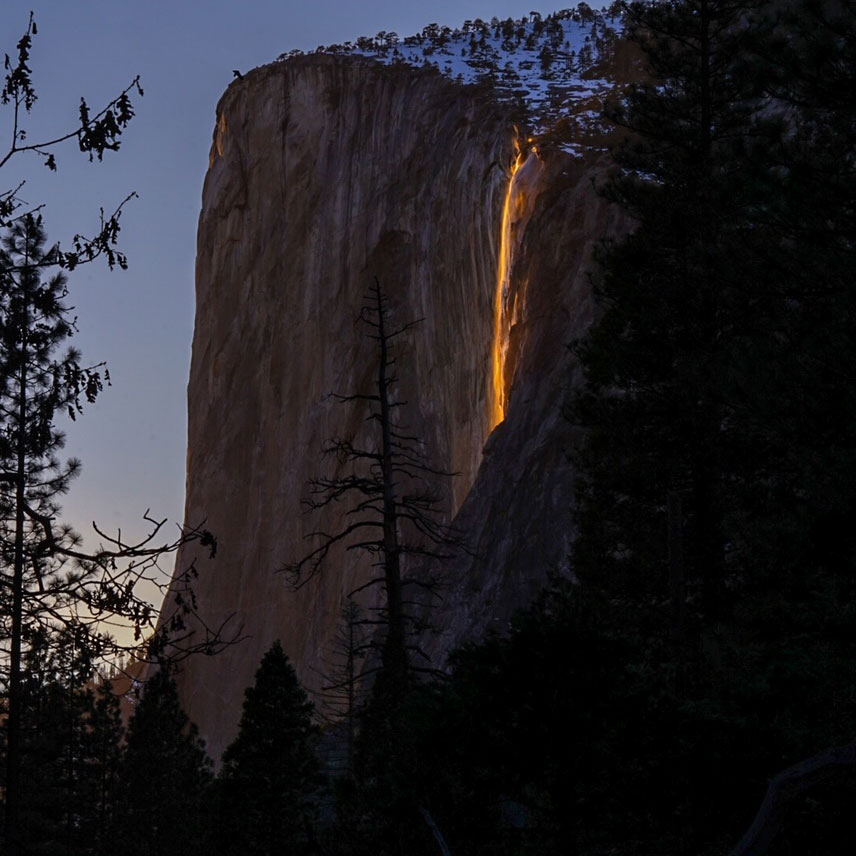
Then there is the ephemeral exception that no gage can rescue: Horsetail Fall in Yosemite (1,570 feet, on tiny seasonal Horsetail Creek). It runs only in winter and early spring and is famous for the mid-to-late February 'firefall,' when late-afternoon sun lights the thin ribbon of water orange — but only if there is enough snowmelt to flow and the western sky is clear at sunset. No mainstem gage predicts a creek that small; for Horsetail, recent snow and a cloudless forecast matter far more than any cfs reading, and the gage is at best a hint that the valley is wet enough for it to flow at all.
A Repeatable Pre-Trip Workflow
Build a simple routine you run a few days before any waterfall trip. Step one: from the falls' ChasingFalls page, note the watercourse, land manager, and best season — for Crabtree Falls that's Crabtree Creek, George Washington National Forest, and the spring snowmelt window. Step two: find the USGS gage on that watercourse or, failing that, the closest gage in the same basin (for Crabtree, the Tye River at Lovingston, 02027000), and save its site number and URL. Step three: open the gage's WaterWatch percentile and the multi-day hydrograph, and judge today's flow against the stream's normal band.
Step four: line the flow up with the season and the weather. If a snowmelt falls is reading high percentiles in late April, go. If a rain-fed falls like Amicalola is sitting near median with no rain forecast, wait for a storm and re-check the gage on the back side of the pulse. Step five: confirm access independently of the water — check the land manager (NPS for Yosemite, USFS for the Columbia River Gorge and George Washington National Forest, the relevant state park for Amicalola) for road, trail, and seasonal closures, because a roaring falls behind a gated winter road does you no good.
Finally, calibrate the gage to your own eyes over time. The first visit, record the discharge you saw and how the falls actually looked; on later trips, compare. After a few data points you'll know that a given creek at, say, the 80th percentile means a full, photogenic falls, while the 30th percentile means a thin one — a personal rating curve far more useful than any generic rule of thumb. The gage doesn't replace judgment; it gives your judgment real numbers to work with.